Quarter beginnings usually resonate with growth marketers.
Maybe because that’s when they are preparing their tactical plan, establishing their goals, or just because it's the time for them to think more deeply about their strategies. Regardless, it hasn’t been different to our customers; and that’s exactly the time of the year they usually reach us asking for help to plan their AB tests.
Formulating a roadmap is not always enough for efficient split tests. That’s why we came up with this complete guide to help you test your hypotheses and plan your next marketing strategies.
Test individual elements or full journeys with advanced AI-powered segmentation, great performance, no-code rollouts, and flicker-free experiments.
The step-by-step for a good AB testing plan
We've already covered some of those topics in other blog posts. Let's revisit them now.
How to organize your testing hypotheses
Listing testing hypothesis requires both data knowledge and creativity, and there's nothing better than brainstorming. Invite all your team members to a 1-hour meeting and let them brood about what should make the conversion rates improve. The more diverse this team is, the better: ask help from designers, copywriters, engineers, data scientists, marketing, and product people.
You should list from 10 to 20 hypotheses to plan your quarter tests.
Example: Donna, a holistic therapist, is trying to get more clients in Singapore, where she lives. These are some ideas she decided to test on her website:
- Discounts for specific services and fidelity campaigns
- First purchase discounts
- A new CTA for limited time to purchase with discounts
- New videos and blog posts for engagement
- New landing pages based on the weather
- Clients testimonials
- Online courses with simple practices users can try at home
- Personalizations based on users’ last sessions
- New heroes with engaging images and copies
- New headlines
If you’re not sure what to begin with, here are some important questions to consider:
- What is the goal of each test?
- What KPIs are you trying to improve?
- What data you have available for the area of improvement?
- What is the impact of confirming these hypotheses?
- How long will it take to implement each test?
- Who needs to be involved in each task?
If you don’t know how to answer some of these questions, invite your team to collaborate and score the impact, confidence, and ease of the ideas you’ve come up with. You can use the ICE Score method to do that, which we’ll cover in the next section.
How to prioritize test ideas
Deciding where to start can be one of the most challenging steps. Luckily, a smart method can help you with that: the ICE scoring.
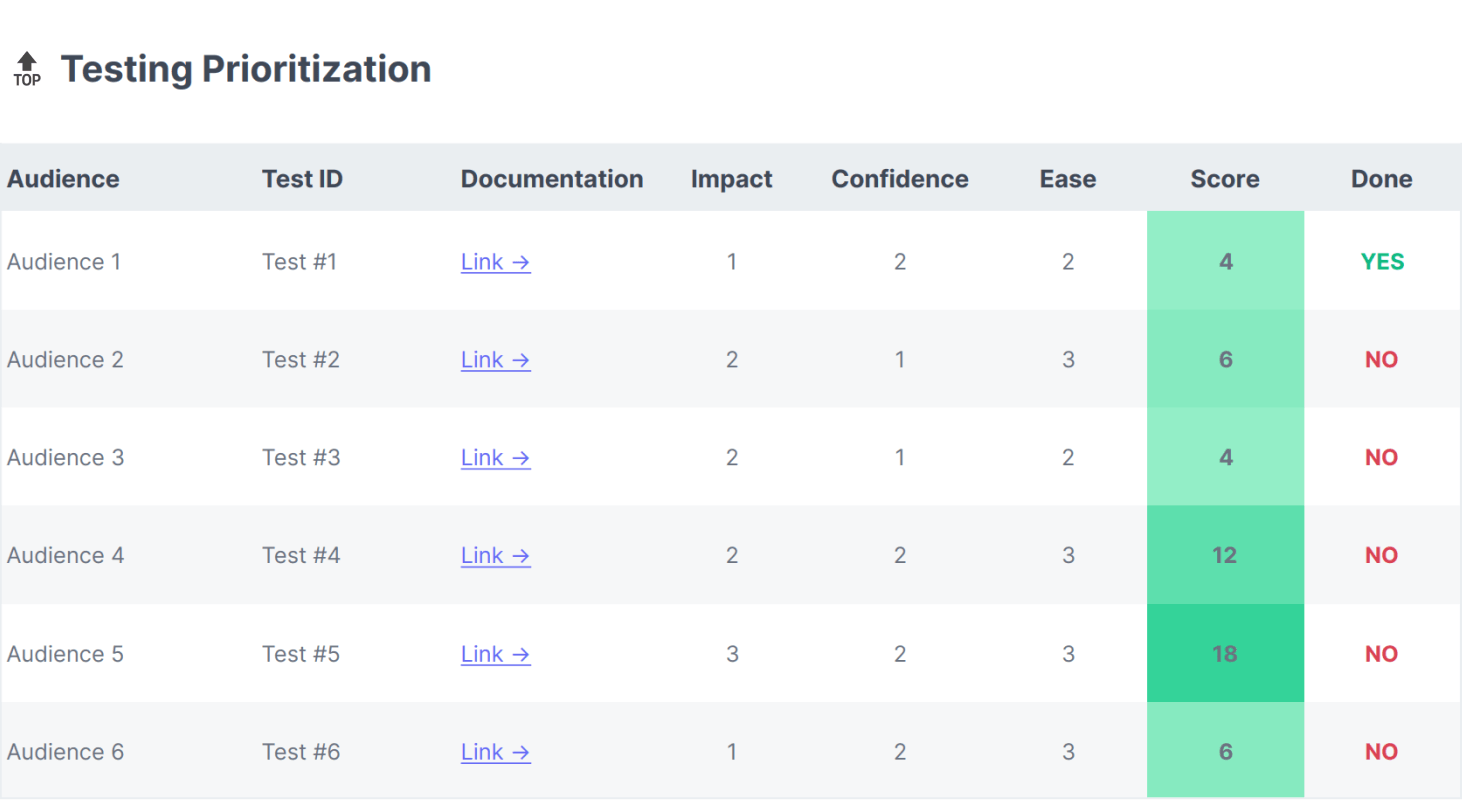
The ICE score model is widely used by growth and product teams to prioritize features and experiments. It helps you evaluate each option by pointing out its impact, your confidence in its potential result, and the ease of implementation. Then, you can rank all options by multiplying these three values to calculate the score.
If you wish to know more about how it works, check out this blog post.
If, just like in the table above, you have different audiences you’d like to test, remember to take a step back to “how to organize your testing hypotheses”. Consider the relevance of your targeted audiences and which pain points you can address by testing new hypotheses.
You should also consider:
- What approaches your competitors already validated
- How your ads are performing
- What keywords bring you most traffic
- What trends there are in your industry right now
- Which personas are interacting the most with your product
Collecting existing data for your experiments and implementing it will have a huge impact on your marketing strategies throughout the next months (or years). Remember that prioritizing the right ideas saves you both time and money.
Which metric to use for analyzing tests performance
This should be the easiest step. Usually, your primary metric is very straightforward and highly related to your business goal. However, we strongly suggest you define secondary metrics to help you in the analysis: it is not unusual to run experiments that don't impact the primary conversion rate but change the mid-funnel metrics significantly.
The metrics you choose are generally defined by the goals you expect to achieve with your experiment. However, these are common points to pay attention to:
-
CTR: which specific elements in your test got the most interactions (a button, an image, a new CTA)? Is this change applicable to other slots throughout your website?
-
CAC and NPS: has the cost of acquiring new customers decreased? Are customers happy with their current experience?
-
ROI: did you get an equivalent return on investment of both time invested and costs?
AB tests have specific metrics you should analyze to validate hypotheses. But don’t forget to be creative in your analysis and formulate more hypotheses on why an experiment had more interaction, or how your audience would answer to a minor change. This will allow you to continue creating engaging content that resonates with all variations of your winning test.
How to estimate the test duration beforehand?
From a purely statistical perspective, estimating the test duration is easy after determining the sample size. However, you have to take some things into account:
- What is your current conversion rate?
- What is the minimum improvement you expect to detect in your experiment?
- How many variations will the test have?
All these factors can affect the duration. But it is also important to highlight that you will only know it after your test runs. If the impact of the variant over the baseline is too small, you would probably want to run the test for at least a little while to observe statistical confidence.
You can use the calculator we provide in our free template.

Which method to use to analyze the results
The most used methods are the frequentist and the Bayesian.
The frequentist inference was developed in the 20th century and became the dominant statistical paradigm, widely used in experimental science. It is a statistically sound approach with valid results, but it presents limitations that aren't attractive in AB testing. On the other hand, the Bayesian approach has become the industry standard based on our benchmark, providing richer decision-making information, although the frequentist is still widely used.
How to document the process for future reviews?
Documenting AB tests should be a very straightforward exercise, but many folks dread this aspect of running experiments. It doesn't need to be demanding, so we made a template to help you organize the most critical information. It should guide you on documenting the hypothesis, the target metrics, the results, etc.
A free template guide for you
To help you plan your AB tests, we've designed a free template in a spreadsheet format.
This guide should provide you with:
- A list of ideas to test on your website
- A tool to help you prioritize your experiments using the ICE score
- A calculator to estimate how long you should run your tests
- A template for documenting your experiments
Feel free to download it and share it with your friends if you find it useful!
And if you want to rely on an easy to use platform for creating your tests autonomously and without needing daily help from devs, create your free account and explore Croct.