Bayesian or frequentist: which approach is better for AB testing?
When analyzing AB tests, it's common to ask ourselves what is the best statistical approach to rely on. This post is focused on discussing two of the most used approaches in the experimentation market.
Benchmark
Before answering this question from a scientific point of view, it's essential to understand how some companies approach AB testing. Therefore, we have set some benchmarks to compare popular AB testing tools regarding four key aspects:
- The approach to interpreting test results
- The key metrics tracked
- Whether the company's core feature is AB testing.
The benchmark shows that companies offering AB testing tools as a core feature prefer the Bayesian approach over the frequentist.
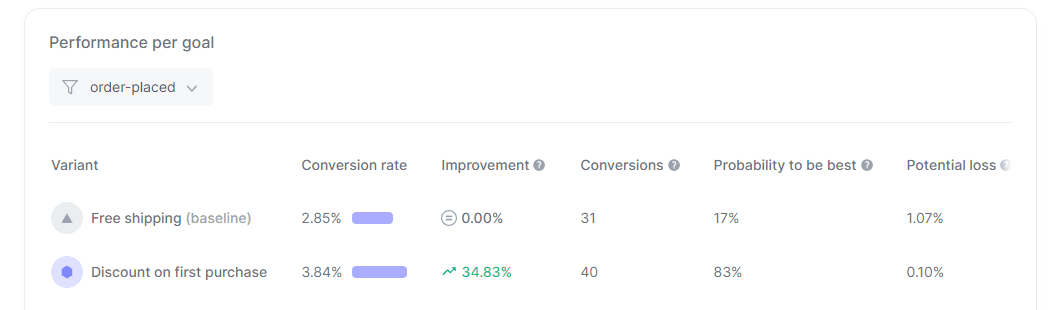
Another critical aspect observed is that companies using the Bayesian approach can present more detailed metrics (e.g., the probability of being best and the potential loss). In contrast, those using the frequentist approach have limitations on what they can calculate, which means they mostly use simplistic metrics (e.g., the conversion rate and the uplift).
The Bayesian approach seems an industry standard based on this benchmark, providing richer decision-making information, although the frequentist is still widely used.
The following table summarizes the approach and metrics used by the popular tools.
| Company | Approach | Metrics |
|---|---|---|
| AB Tasty | Bayesian | Conversion rate, reliability, improvement, median growth |
| Dynamic Yield | Bayesian | Probability to be best, uplift, sessions, revenue, revenue/session |
| Coveo | Bayesian | Converters, probability of uplift, probability to beat baseline |
| Growthbook | Bayesian and frequentist | Offers diferent metric possibilitiess depending on your set up and data source |
| Eppo | Frequentist | Metrics lift, confidence interval |
| PostHog | Frequentist | Conversions, probability to beat control |
| Statsig | Frequentist | Metrics lift, confidence interval |
| Launch Darkly | Bayesian | Conversions, probability to beat baseline |
| Convert | Frequentist | Conversion rate, reliability, upflift |
| VWO | Bayesian | Expected conversion rate, improvement, probability to beat control, conversions/visitors, absolute potential loss |
| Amplitude | Frequentist | Conversion, probability to beat control |
| Crazy Egg | Frequentist | Total traffic, visitors, conversions, conversion rate, improvement |
| Hubspot | Frequentist | Open rate, click rate |
| One Signal | Frequentist | Clicks, click-through rate, delivered notifications |
| Optimizely | Frequentist | Unique conversions/visitors, conversion rate, improvement, confidence interval, statistical significance |
| Unbounce | Frequentist | Visitors, views, conversions, conversion rate |
Test individual elements or full journeys with advanced AI-powered segmentation, great performance, no-code rollouts, and flicker-free experiments.

The Bayesian approach
Bayesian statistics is a theory that treats probabilities as the degree of belief in an event (e.g., how certain one is about the conversion rate of a call-to-action button).
The core idea of Bayesian statistics is to update one’s beliefs after being exposed to new evidence. For example, updating what is the most likely conversion rate after gathering new data describing conversion events.
Unlike the frequentist approach, Bayesian treats everything as a random variable, which by definition has a probability distribution (e.g., Gaussian) and parameters (e.g., mean, variance). This means that it's possible to estimate the probability that each variant is the best – and by how much – and the potential loss associated with each variant using the posterior probability distribution.
These results are crucial to making the best and safest decision after the test ends. That explains why so many arguments favoring the Bayesian approach are concerning the results' quality.
Another key benefit is that there are fewer constraints to Bayesian AB testing. Although it's always recommended to run the test for at least one week, users can stop the test as soon as they believe the results are safe and conclusive enough to make a decision. For example, if there are many sessions and conversions in a day, it might be possible to estimate with high confidence which variant is the best after a single day.
The Frequentist approach
Frequentist inference is a method developed in the 20th century that grew to be the dominant statistical paradigm, widely used in experimental science. It is a statistically sound approach with valid results, but it presents limitations that aren't attractive in AB testing.
Moreover, the interpretation of the results is more complex than the Bayesian approach, an opinion shared by experts in the field. The metrics are confusing and often misinterpreted (there's even a Wikipedia page describing the misuse of the "p-value", the score obtained using the frequentist approach). This behavior is highly undesirable in AB testing, as the results directly impact business decisions.
Briefly put, the frequentist approach to AB testing commonly follows these steps:
-
Define the control and treatment groups
-
Define the null and alternative hypothesis
Usually, these are:
- Null hypothesis: the conversion rate for control and treatment groups are the same
- Alternative hypothesis: the conversion rate for the treatment group is different from the control. Ideally, the test ends refuting the null hypothesis, stating a difference in conversion rate resulting from the changes made.
-
Define the confidence level
This defines the significance level (commonly known as the "p-value").
-
Define the test duration
There are online calculators available to decide the duration based on:
- The average number of visitors participating in the test (for control and variants)
- Estimated conversion rate
- Minimum detectable improvement in conversion rate
- Total number of variants (including control)
As these calculators highlights, the test duration for the frequentist approach is always longer than the Bayesian.
-
Run the experiment for the predefined period and just then analyze the result
To avoid false positives, frequentist AB testing doesn't allow data peeking. Thus, users obtain the results only at the end of the test (the result here is whether or not to refute the null hypothesis, according to the "p-value" or "test statistics").
The rationale behind this is that the statistical significance fluctuates during the test, so stopping a test once it reaches statistical significance is a recipe for undesirable outcomes. The image below shows the analysis for two identical variants. As you can see, the P-value varies even when there is no difference between them.

Source: Medium
As the steps described, the primary constraint is not seeing the results before the test ends, which is potentially costly for companies. Moreover, the frequentist result is a simple binary outcome: either there is a difference between control and variants or not (assuming users interpret the p-value correctly).
Frequentist vs. Bayesian
The following table summarizes the key differences between the Bayesian and frequentist approaches to AB testing.
| Frequentist | Bayesian | |
|---|---|---|
| Size of the Sample | Predefined | No need to predefine |
| Test duration | Fixed and longer** | Flexible and shorter |
| Results' intuitiveness | Low, as the p-value is a derived metric | High, as the results are directly calculated |
| Data peeking during the test | Not allowed | Allowed (with caution) |
| Velocity to make decisions | Slow, as it presents more constraints | Fast, as it has fewer constraints |
| Estimate the probability to be best (PBB) | Not possible | Possible regardless of the variations count |
| Estimate the potential loss | Not possible | Possible regardless of the variations count |
| Declaring a winner | When the p-value is below a threshold and the sample size is achieved | When either the potential loss is below a threshold or the PBB is above a threshold |
| Results computation | Less computationally intensive | More computationally intensive due to simulations |
For more details on the differences between frequentist and Bayesian approaches, we recommend the following references:
- Comparison of Frequentist and Bayesian Inference, by MIT Mathematics
- Bayesian AB Testing, by Lyst
Why we use the Bayesian approach
The choice of using Bayesian over the frequentist approach stems mainly from the fact that its results are a lot richer and more informative than the simplistic frequentist's binary outcome.
For example, the frequentist approach doesn't predict a variation being the best or potential loss. It relies on reaching statistical significance to conclude a test, and the result simply states if there is or isn't a difference between a variation and the baseline.
Moreover, the limitations on using the frequentist approach are often unattractive for companies. For instance, it requires predefining a sample size and test duration, a feature that might discourage companies from using it.
These arguments support the decision of choosing Bayesian over the frequentist approach.
The Bayesian approach does not eliminate the risk of making the wrong decisions – it is a way to make better decisions in the face of uncertainty, measuring the impact of undesirable outcomes and their probabilities.
Analyzing Bayesian tests is easy with Croct, as our dashboards allow you to track all the necessary metrics in real time.
Create your free account and explore our platform by yourself to learn more about how our AB testing functionality works.