Learn the difference between feature flags and AB testing and map the lifecycle of a feature rollout to mitigate risk and accurately measure business impact.
19 posts about
Learn the difference between feature flags and AB testing and map the lifecycle of a feature rollout to mitigate risk and accurately measure business impact.

A game-changing addition to the Croct ecosystem: CMS-powered UI library of components and templates designed for personalization, AB testing, and fast iteration at scale.

The rise of component-based CMS solutions is transforming how businesses structure and optimize their digital experiences.

Feature flags (or feature toggles) allow product teams to control the rollout of new features without redeploying code. They are widely used to enable AB testing, perform gradual rollouts, and reduce risk when releasing new product features.

A component CMS offers product teams more autonomy to experiment without over-relying on developers and maintaining a structured content architecture that scales with the product.

Conversion rate optimization (CRO) and experimentation are critical to improving a product’s performance. Yet, despite their importance, they remain challenging to execute, especially for the product UI.

As React has become one of the most popular frameworks for building user interfaces and most traditional AB testing platforms work by manipulating the DOM after the page is loaded, it can be a problem, depending on how your React application runs.

Learn why customer retention is vital for SaaS, key metrics to track, common challenges, and proven strategies like personalization, onboarding excellence, and proactive support to keep users engaged.
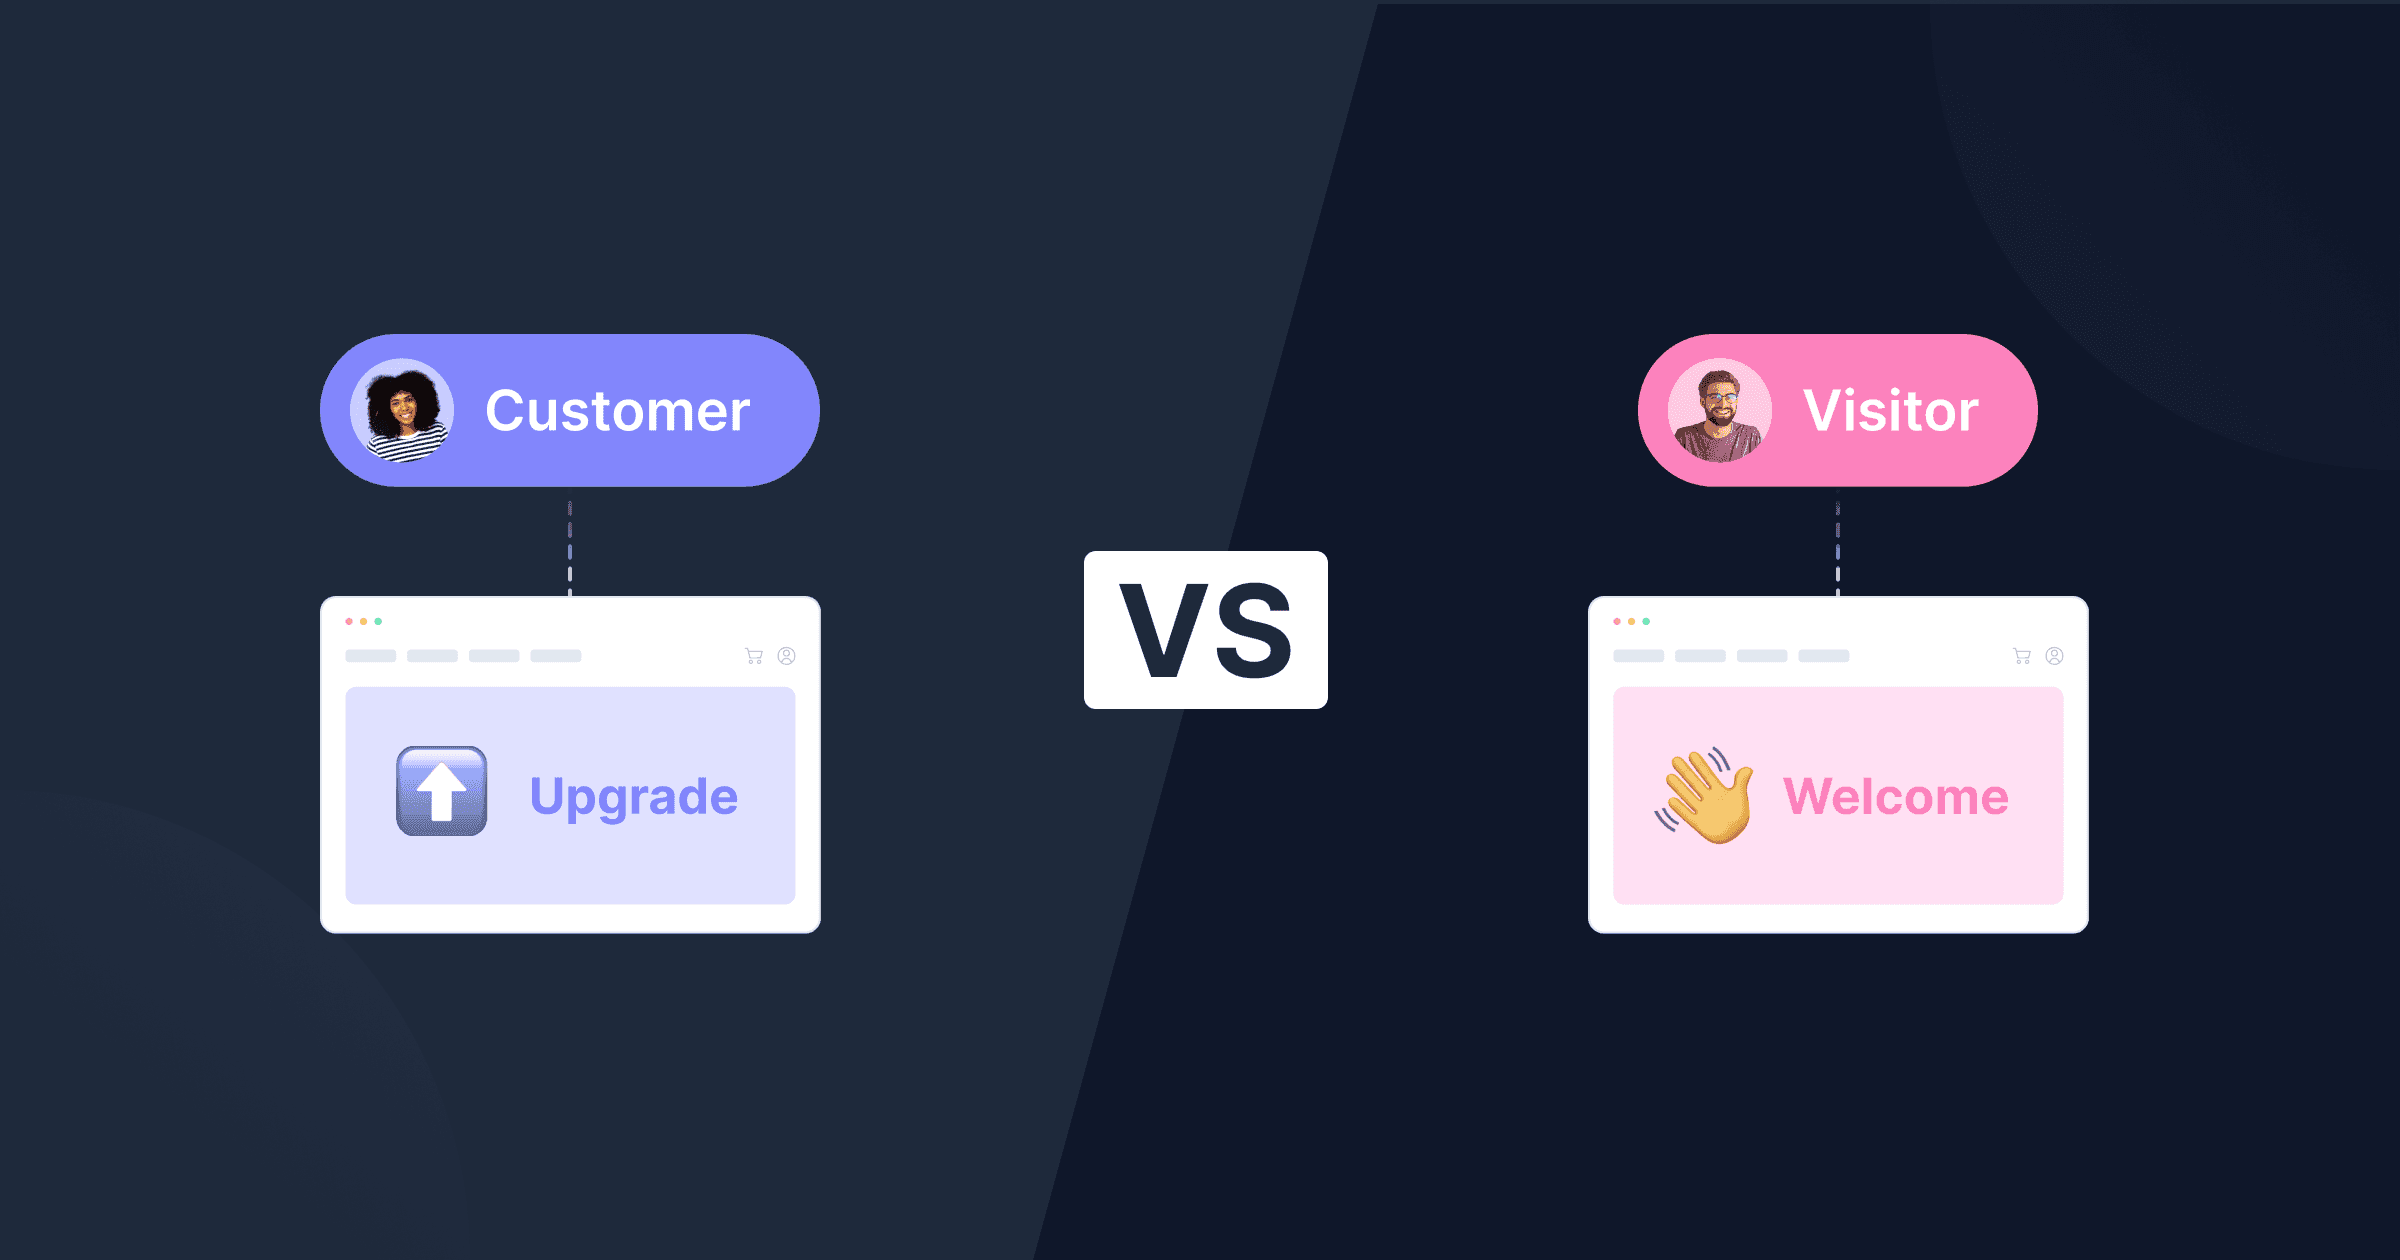
Segmenting customers from visitors helps you overcome the challenges of delivering relevant communication. In this blog post, we'll provide you with examples of personalized offers for these two different audiences.

If you manually manage multiple tags on your websites or apps, you are wasting time. Find out how a tag manager can simplify this process and provide more accurate data. This article explains everything you need to know to save time and resources.