10 posts about

Experimentation

Image with dark background containing Croct's logo, a graph emoji and text that reads "Why (and how) visual editors impact performance"

Visual editors are the superheroes of website optimization, but they also have drawbacks. In this post, you will learn the pros and cons of using them, and alternatives to prioritize performance.

Image with purple background containing Croct's logo, a test tube emoji and text that reads "How do you talk your boss into AB testing?"

Did you ever have your boss push you back on AB testing? This article will give you all the arguments you need to show why this is a must for any data-driven marketing approach these days!

Image containing a circle representing the CRO cycle stages: analysis, ideation, implementation, testing, and checking results.

Many CRO teams perform AB tests daily. Some professionals learn extra tech skills to become autonomous and code their own experiments. But wearing too many hats shouldn't be the industry standard.

Two wireframes representing different versions of the same website, one in purple, with the letter A on top, and one in green with the letter B on top.

AB testing the content on your website allows for data-driven decision-making and improves user experience. Ready to start taking advantage of it? Start now by reading our guide.

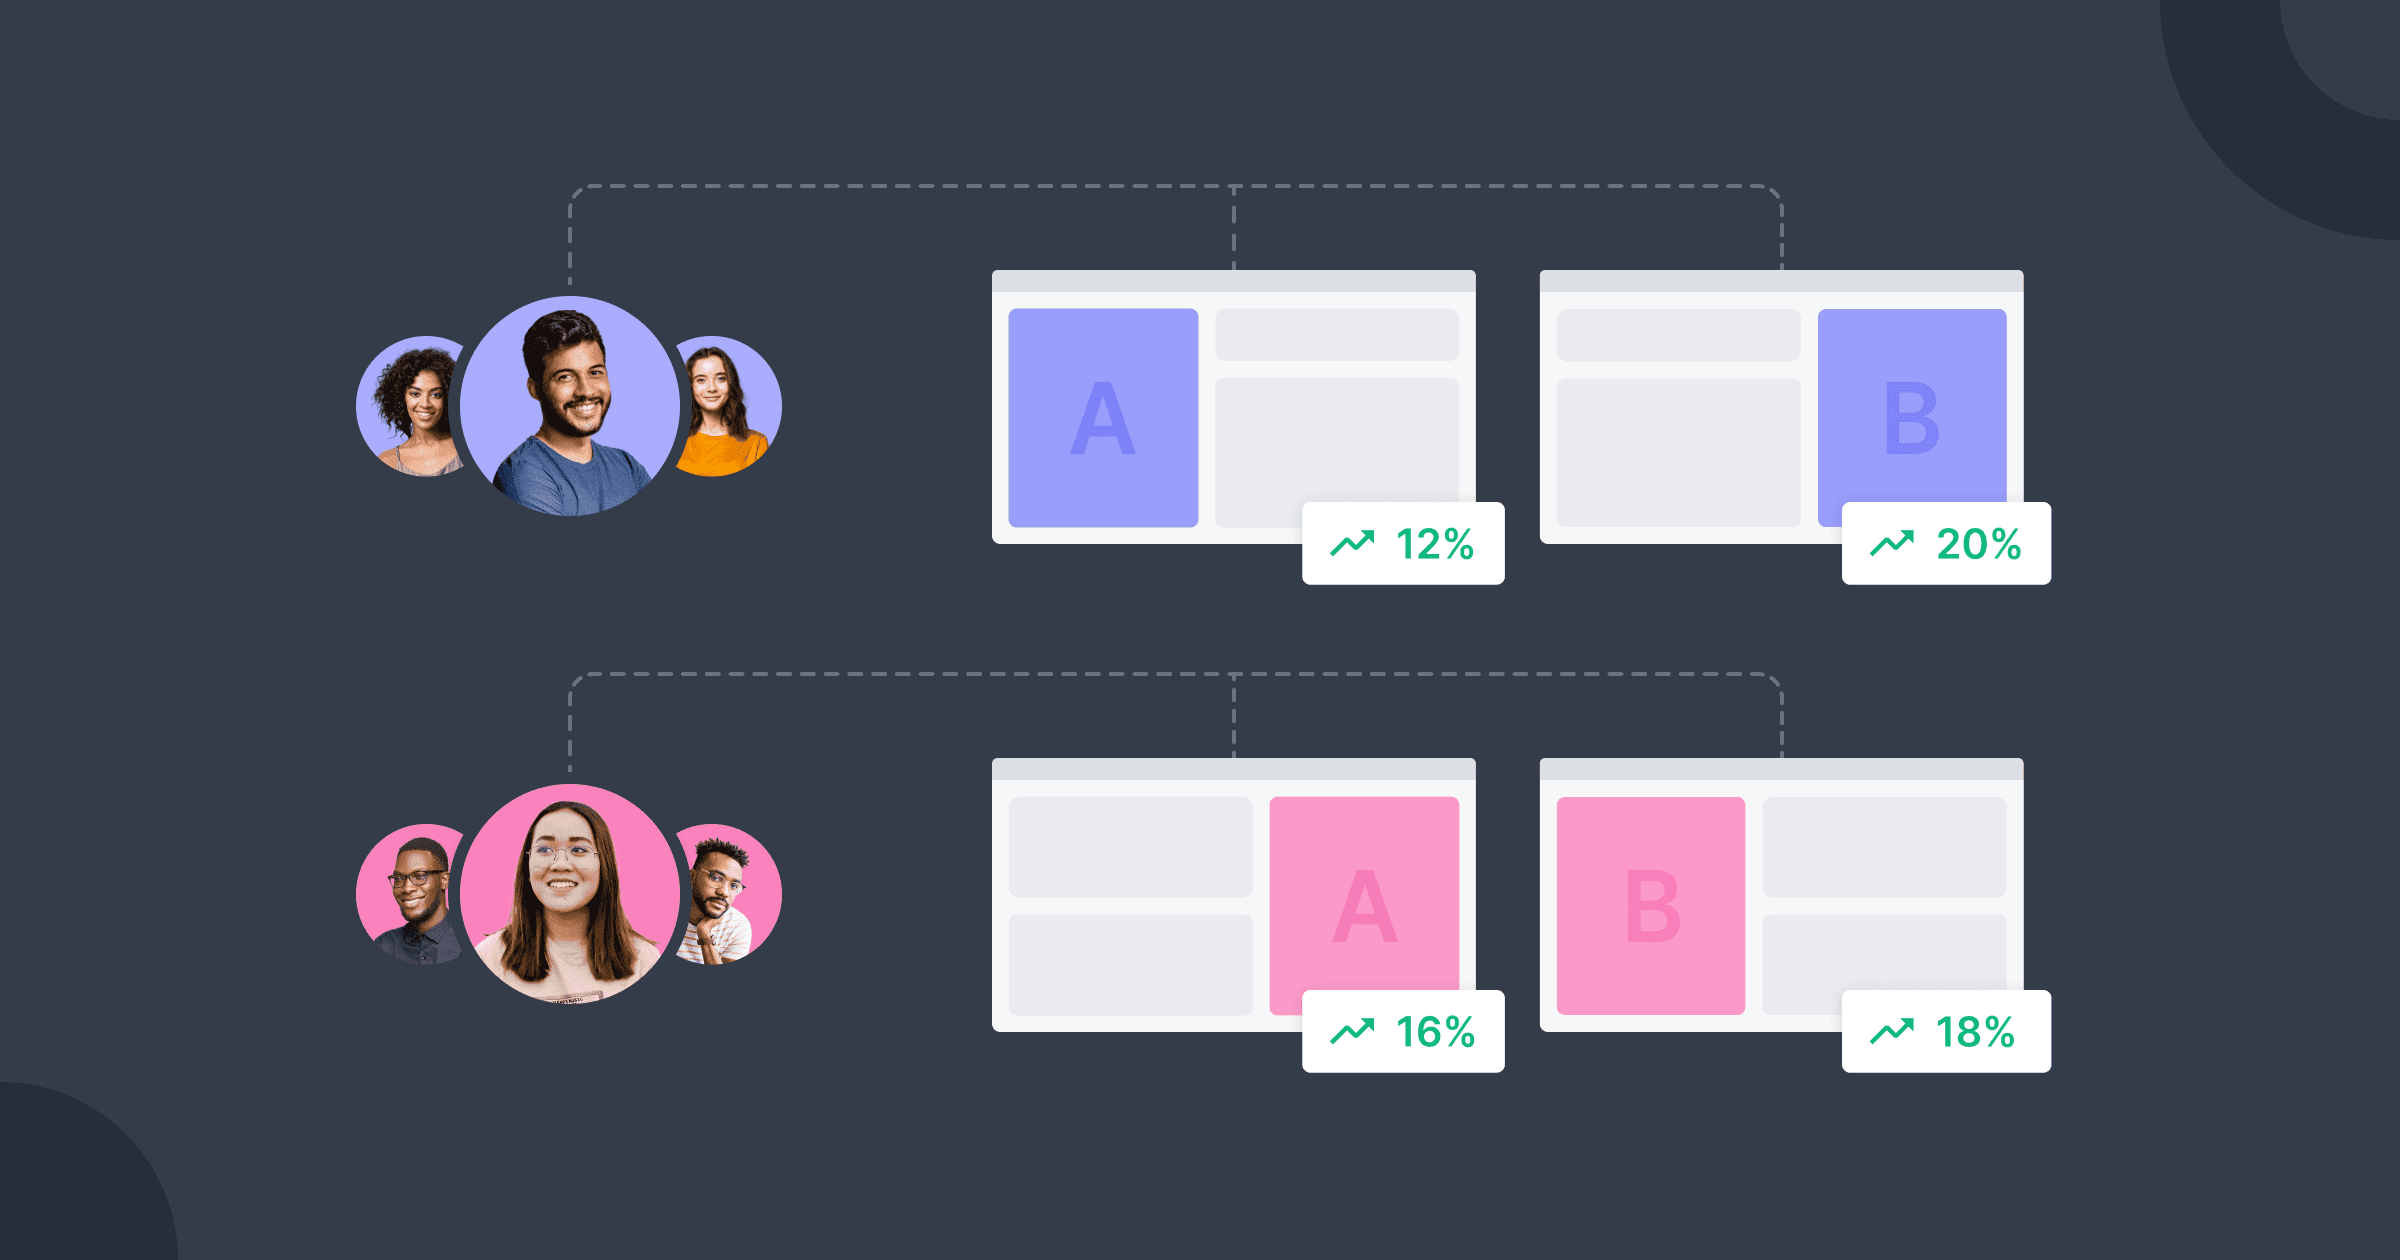
Two user segments linked to two pairs of pages representing two different versions of the same AB test.

No one can argue that introducing personalization to your marketing strategies can take your results to a new level. Now, it's time to learn how you can really change the game by combining it with AB testing.

A spreadsheet wireframe and a website wireframe with the left side in green with an A in the middle and the right side in purple with a B in the middle representing an AB test.

This AB testing template is all you need for planning and documenting experiments. It will help you estimate tests duration, prioritize the right ideas in your backlog, and come up with new ones.

A website wireframe. The left side is green and has the letter A on it, and right side is purple and has the letter B on it.

In this last post of the series, we'll take a closer look at how Croct's AB testing engine works, covering the most relevant factors in declaring a winner variant.

A graph representing the Bayesian analysis probability distribution.

From the hypothesis to the conclusion, this detailed technical overview of the Bayesian approach to A/B testing explains the terminology, math, and concepts behind the method.

Grey image with graph representations of both Bayesian and frequentist approaches.

When it comes to AB testing, Bayesian and frequentist methods have inherent advantages and disadvantages. Let's look at how they work and which approach is right for you.

An open book linked to two wireframes, one with the letter A on it, and the other one with the letter B. Wireframe A has a trophy in front of it, indicating it is the winner of the test.

Conversion rate optimization is all about AB testing. Whether you're a beginner or a seasoned pro, this comprehensive guide will be a valuable resource for you.

Let's grow together!

Learn practical tactics our customers use to grow by 20% or more.